Examples / Sensitivities / corr
This file is a complete demo of the capability of the corr function from the CODES toolbox.
Contents
Documentation
The documentation for the corr class can be found here.
Set rng
Set random number generator seed:
rng(0)
Simple example
Compute correlation coefficient using all three kind:
f=@(x)1/8*prod(3*x.^2+1,2);
X=rand(100,3);Y=f(X);
res=CODES.sensitivity.corr(X,Y,'type',{'pearson','spearman','kendall'});
disp(res.pearson.rho)
disp(res.spearman.rho)
disp(res.kendall.tau)
          X_1       X_2       X_3
Y_1  0.447453  0.450872  0.444224
          X_1       X_2       X_3
Y_1  0.496946  0.459574  0.469595
          X_1       X_2       X_3
Y_1  0.349495  0.311111  0.321212
Pie plot
Compute sensitivity indices and plot them (pie):
f=@(x)1/8*prod(3*x.^2+1,2);
X=rand(100,3);Y=f(X);
CODES.sensitivity.corr(X,Y,'pie_plot',true);

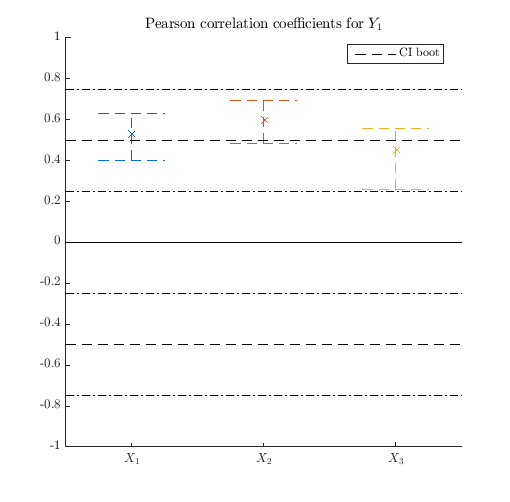
Error plot
Compute sensitivity indices and plot them (error) using bootstraped confidence interval:
f=@(x)1/8*prod(3*x.^2+1,2);
X=rand(100,3);Y=f(X);
CODES.sensitivity.corr(X,Y,'err_plot',true,'CI_boot',true);
Copyright © 2015 Computational Optimal Design of Engineering Systems (CODES) Laboratory. University of Arizona.
|
|
Computational Optimal Design of Engineering Systems |

|